

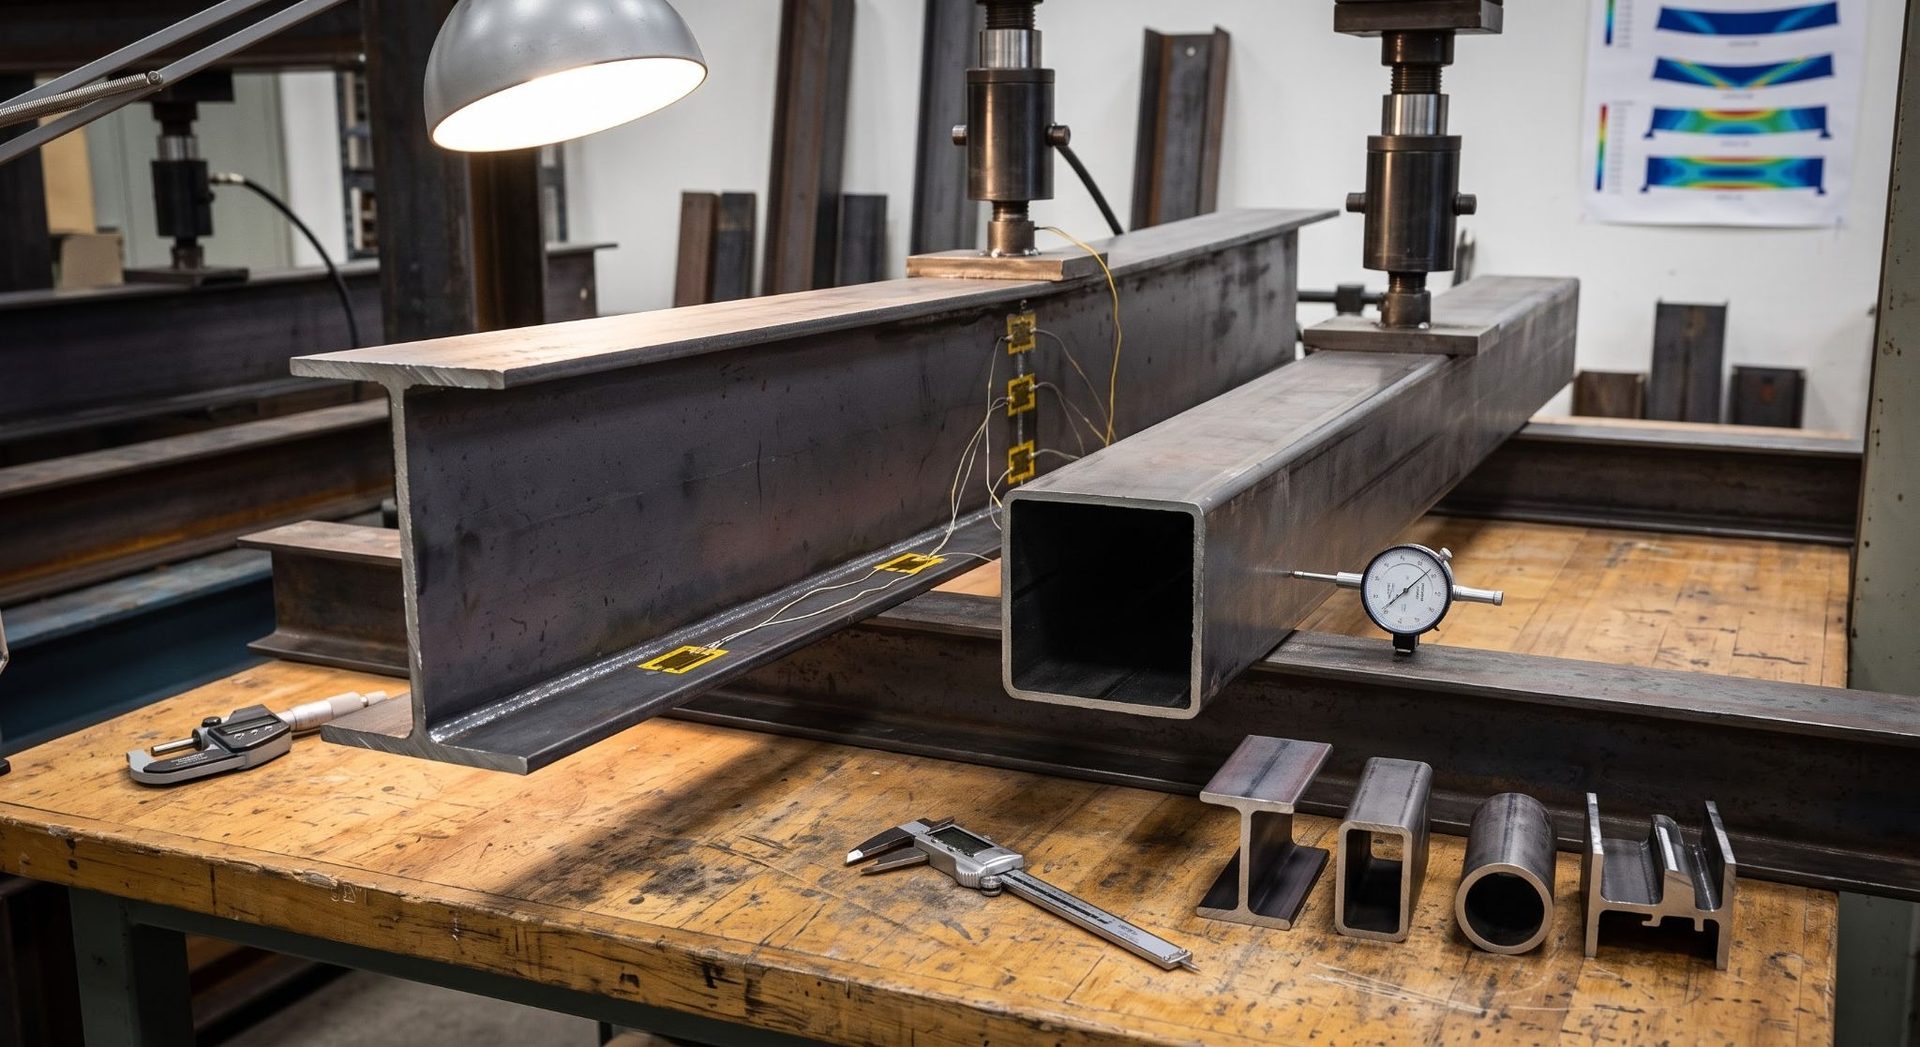
A beam passes its deflection check by hand calculation, then the finite element model of the same beam returns a noticeably larger displacement. The classical formula accounts for one deformation mechanism.
Real beam behavior involves several, and part of the cross-sectional area never fully participates. This article examines the corrections that sit between a tabulated section property and the stiffness a beam actually delivers.
What Sits Behind the Product EI?
Flexural rigidity is the product of two quantities: the modulus of elasticity of the material and the second moment of area of the cross-section. The first simplification is reducing the entire section geometry to a single scalar.
The second simplification is built into the problem statement. Classical deflection formulas rest on the plane-section hypothesis in its Bernoulli form, where a section stays plane and, on top of that, perpendicular to the deflected axis.
Zero shear strain follows from that perpendicularity. Timoshenko beam theory keeps the section plane and drops the perpendicularity condition: the section rotates independently of the slope of the axis, and the difference between the two angles is the shear angle.
For long slender beams, the discarded term is small. It stops being small earlier than commonly assumed.
Shear Adds to Deflection and Grows on Short Spans
Total deflection is the sum of a bending part and a shear part. For a center point load, the bending part scales with L³ and the shear part with L.
The ratio of the two equals 12EI/(G·A_v·L²), where A_v is the shear area of the section. The shorter the span relative to depth, the larger the shear share.
In an I-section, these two quantities come from different parts of the cross-section. The second moment of area is built up by the flanges.
The shear area in major-axis bending reduces essentially to the web. The balance between them depends on the proportions of the profile.
For a solid rectangular section at a span-to-depth ratio of 12, shear accounts for roughly 2% of total deflection.
For a welded I-girder 600 mm deep with 300×20 mm flanges and a 10 mm web, the shear component at the same ratio reaches 11%. Drop the ratio to 8, and the share rises to 22%, at 6 it reaches 33%.
The working rule that permits ignoring shear above a span-to-depth ratio of 10 to 12 holds only for compact sections. Thin-walled profiles need shear accounted for at considerably longer spans.
Published analysis puts the threshold for solid sections at a span-to-depth ratio below 10, with the shear contribution reaching 46% at the inverse ratio h/L = 0.6, a very short and deep member.
A Wide Flange Does Not Work Across Its Full Width
Normal stress distributes unevenly across the flange width. It peaks where the flange meets the web and falls toward the tips, a consequence of how force is transferred into the flange. The effect is called shear lag.
EN 1993-1-5 (2024) sets a direct limit: shear lag in flanges may be neglected when the flange outstand is less than one-fiftieth of the distance between points of zero bending moment.
Past that limit, the calculation uses an effective width, b_eff = β·b₀, and the factor β differs between serviceability and ultimate limit state checks on the same flange.
For global analysis, the standard gives a simpler rule: effective flange width is the lesser of the gross width and one-eighth of the span on each side of the web. Clause 4.3(1) assigns the effect to member stiffness, so it feeds straight into calculated deflection.
Box girders, welded profiles with wide flanges, and orthotropic decks feel this most.
For a Fabricated Section, Properties Are Recalculated
Section properties for rolled profiles come from standard tables. Non-standard sections (welded girders, boxes, and profiles with cover plates) have no such data.
The reduction procedure changes the input geometry: where section elements are reduced, properties are computed from the effective width, and the analytical geometry no longer matches the drawn geometry.
Changing plate thickness or flange width forces a recalculation of the entire property set (area, centroid, second moments and radii of gyration).
Across many candidate variants, hand calculation stops paying off. Entering the geometry in a moment of inertia calculator is faster and returns properties for the whole set of sections at once.
Those properties then feed the same shear and effective-width corrections, which makes it cheaper to settle the geometry before moving to the analysis model.
A Thin Web Reduces Stiffness Under Separate Rules
Slender compression elements can buckle locally before the yield stress is reached, which takes part of the area out of service (Class 4 sections in Eurocode nomenclature).
For deflection checks, EN 1993-1-5 defines a separate procedure, distinct from the strength calculation. The plate slenderness used for stiffness is scaled by the square root of the ratio of actual compressive stress under serviceability loads to the yield stress.
A lightly loaded thin-walled flange takes a smaller stiffness penalty than the same flange checked at full design load.
The second moment of area for deflection comes from interpolating between gross and effective section properties. Substituting the effective value directly for the gross one overstates deflection.
A threshold also applies below which no correction is needed. Where the effective area of a compression element at ultimate limit state stays above half the gross area, the influence of local buckling on stiffness may be disregarded.
Geometry Sets Torsional Stiffness by a Different Route
Flexural and torsional stiffness are governed by the same cross-section but formed by different resistance mechanisms. Optimizing a section for bending stiffness alone delivers no proportional gain in torsional resistance.
Saint-Venant torsion of an open profile is approximated as a set of thin strips: J ≈ Σ(1/3)b·t³, with thickness entering as a cube.
Torsional stiffness of a closed contour follows Bredt’s formula: J = 4A_m²/∮(ds/t), where A_m is the area enclosed by the mid-thickness line of the walls. In the closed contour the numerator carries the square of that enclosed area, which is why the resulting values diverge by orders of magnitude.
Take a 400×200 mm envelope in 10 mm plate. The welded I-girder gives a second moment of area of 19,786 cm⁴ and a torsion constant of 26.0 cm⁴. A rectangular hollow section of the same envelope and wall thickness gives 24,359 cm⁴ and 18,934 cm⁴.
The tube uses 48.7% more steel and carries 23.1% more bending stiffness, while its torsion constant is 728 times larger.
Matching the sections on area tells the same story. With a 6.65 mm wall the tube has the same cross-sectional area as the girder. Its bending stiffness falls to 84.4% of the girder’s, and its torsion constant still exceeds the open profile by a factor of 504.
As SCI P385 states, the torsional stiffness of hollow sections is far greater than that of open sections of comparable size.
Where the Gap Costs the Most?
Every effect described here is cumulative, and each pushes actual stiffness below the theoretical value. The reduction matters most on structures with the least deflection margin: short beams and spreader beams, crane support structures held to tight tolerances, wide-flange box girders, and equipment support frames.
Check this while the section can still change. Estimating the shear share and the effective width takes a single calculation and shows how far actual stiffness departs from the tabulated value for a given geometry.
